NOTE · 2026笔记 · 2026
How I work with AI in biomedical research
From my talk AI for Biomedicine: how I plan, run and report experiments with AI, build research tools and slides with it, and why a model that scores well is not yet a model that helps in a hospital.
In September I gave a talk called “AI for Biomedicine” to a network of researchers that Richard Song brings together through OpenRefinery. It started with a conversation in which Richard asked me about my insights on AI in medicine, and I realized I had never organized them. I had been improvising. This post is the organized version, in the order of the talk: my research, then how AI fits into the way I do it, then what happens when models like ours meet a hospital.
AI plays two roles in my work. It is the subject of the research, and it is a tool for doing the research. The two roles end up teaching the same lesson.
Three questions behind my research
I work on cancer imaging at Stanford, mostly lung CT, and I think about any medical AI project through three questions: what data we use, how we train, and how we evaluate. I have one project for each.
Data. A doctor does not assess a patient from a scan alone. They add a blood test and the history. Most imaging models see only the image. During the first wave of COVID-19 in China, we combined chest CT, clinical information and laboratory results from around admission to predict ICU admission, ventilation and death in 2,362 patients. In external validation, the full combination had the highest AUROC for all three outcomes among the combinations we compared (post).
Training. Medical labels cost expert time, extra tests or years of follow-up. We trained a 3D variational autoencoder to reconstruct CT patches around lung lesions, with no outcome label, and reused what it learned. Its features did about as well as radiomics features at predicting KRAS mutation status and nodal stage, although radiomics also gets a drawn lesion mask. Moving through the learned representation makes a generated lesion smaller or larger, which shows what the model captured. Those are generated images, not forecasts of a patient’s tumor (post).
Evaluation. A model that does well on its own test set often does worse at another hospital. We ran published chest X-ray models on public and private hospital datasets. For pneumonia, the eight models averaged an AUROC of 0.81 on adult X-rays from Nanjing and 0.57 on 371 children’s X-rays from the same region. The metric matters too. AUROC measures ranking, but in a clinic a model is a threshold: above some score, someone acts. Before using a model I would fix sensitivity at 95 percent, so at most five of every hundred positive cases are missed, and ask how many negative cases it still rules out. A single AUROC does not answer that (post).
The research loop
My research runs in a loop: define a question, plan the experiments, run them, gather the results, explain them, write them up. The result usually gives the next question. At each station I use a skill, a written procedure an AI agent follows, including what to check and when to stop. Some are public skills I installed. The ones I wrote carry details nobody else has: our GPUs’ memory limits, how our data caches are organized, what I need from an explanation. Between the stations are decisions I still make myself.
The loop as I walked through it in the talk. Boxes are written procedures; diamonds are decisions I do not hand over.
Define
The example started with a sentence that sounded clear to me: extend our lung lesion encoder, a 3D model trained on CT patches, to tasks that use more than one kind of patient data. It left most of the work unstated. Two public skills from Matt Pocock helped. Grilling interviews me in rounds and puts its recommended answer under each question, so I edit instead of composing. Domain-modeling writes down terms as they come up; three words we had been using turned out to mean the same thing.
The interview asked which claim I wanted: that the CT representation adds information, or that we have a better way to combine modalities. I wanted both. It recommended stage and nodal status as the outcome; I chose survival, where I wanted to examine several modalities together. That exposed a dependency: the survival data needed a request that could take weeks, so we filed it and planned around it arriving late. When the skill started a second round of questions, I stopped it. My planning skill then reduces the discussion to four fields: the question, why now, what decision the answer supports, and what counts as finished. I correct that page before anything is planned.
Plan
The planning skill breaks the question into experiments, each with what to run, why, the memory and time it may take, and what result would stop it. It asks whether each experiment really needs the previous one’s output or only follows it in the story; only real dependencies constrain the schedule. Where a cheap step decides whether an expensive one is worth running, it puts a gate, a yes-or-no question that only I answer, and counts my time to answer in the finish estimate.
Two habits matter more than the skill. I use the strongest reasoning model I have for planning, because a planning mistake is paid for by every run after it. And I read the plan before anything starts. Once I found the agent preparing a request for a dataset, drafting letters and filling in forms. I already had the dataset; it was on another server. The agent was missing a fact only I had, and the plan was the cheap place to supply it.
Run
Once experiments start, I need to know what is happening while I am away. A launch skill starts every run with a recorded process, log file and expected output. A status skill checks four signals for each run: the process is alive, it is on a GPU, its log is advancing at its usual pace, its output exists. In one example, a run’s process was alive and holding GPU memory, but its log had not moved for 45 minutes when it normally wrote every five. A process check alone would have called it healthy.
It also reads the loss, because a live process is not useful training. The illustrative report I showed, with invented values:
ssl_lr1e-4   RUNNING  61/100
ssl_lr3e-5   RUNNING  58/100
    loss FLAT: improved 0.3% over the second half (1.697 -> 1.691), plateaued
ssl_lr5e-4   RUNNING  22/100
    loss DIVERGED: loss went NaN, the run is producing nothing
Three live processes: one healthy run, one plateaued, one wasting the GPU. Each needs a different decision.
When I asked the agent to start a step behind an unanswered gate, it refused, showed me the evidence for the gate’s question, and launched only after recording my answer. The limit I named in the talk: that rule lives in the written skill, and the launch script underneath would have started the run anyway. A real guarantee needs the boundary in code. The rules of our shared machines, which I used to keep in my head, are written down the same way, including one that says a GPU at zero utilization but holding memory belongs to someone’s paused job.
Gather
The reporting skill writes the answer first, then the goal, method, what actually ran, results, interpretation, what changes, and what not to repeat. Before writing a number it puts an interval on every difference and checks that comparisons are paired the way the design says. That check exists because of a mistake. Two data caches held the same lesions in different orders, the first analysis paired them by row number, and every confidence interval came out about ten percent too narrow. The numbers looked plausible. Only knowing how the caches were built exposed it.
Explain
When results confused me, I tried a popular “explain it like I’m five” skill. It took the instruction literally. I already know what accuracy and AUROC mean; I needed why we ran the experiment, what we compared it against and what we learned. So I rewrote the skill for a reader who owns the theory but not the implementation: say which project and which question first, define every codename, explain the engineering. The revised explanation of one of my own write-ups showed that its headline number came from one model’s experiment and its claimed improvement from a different comparison, so they could not support one claim. A better explanation caught what the analysis had let through. The rewritten skill has failed too: after a long session it described every component correctly and never said what the project was. That failure is now written into the skill.
Write
A figure skill holds one set of style rules for colors, axes, line weights and formats, for data plots and diagrams alike. It saves me choosing the same formatting every time. Whether the comparison is fair and the figure supports the claim is still mine to check.
Three things I learned about skills
Customize before using. A skill is natural-language instructions. You can read it, ask an AI to explain each step, and rewrite it in plain words, as I did with the explanation skill.
Test before keeping. Kun Chen tested a widely shared set of coding instructions inspired by Andrej Karpathy’s observations and reported worse results with about five percent more tokens. I have had skills whose idea I liked add work instead. My test: pick a representative task, run the same model with the skill on and off, and compare quality, time to an acceptable result including my corrections, and cost. Then tune the skill on that task.
Stay the judge. An agent can carry much of the loop, but it does not know where the value lies: which questions are worth asking and what to do first. The gates are where I make those calls.
Building the tool nobody would fund
AI can also build software around work that still needs a specialist. Our longitudinal studies need each lesion marked on every scan of a patient and linked across visits. Between visits the patient’s position and breathing change, and the lesion changes size and shape. By hand, that meant finding the files and reports, saving a point and a mask for each lesion at each visit, and keeping a table that tracked every finding over time. In our own labeling experience, roughly 20 to 30 minutes per patient, an informal estimate.
No grant would pay for an interface for that, so I built one with AI. Lesion Curator is a browser app that shows two visits side by side, aligned and scrolling together, with the pipeline’s detections and masks on top. The reviewer checks the lung region and alignment, matches lesions across visits, places seed points to correct a mask, reviews volumes and trends, and exports. The pipeline predicts first and the reviewer corrects; edits are stored separately, so the source scans stay intact.
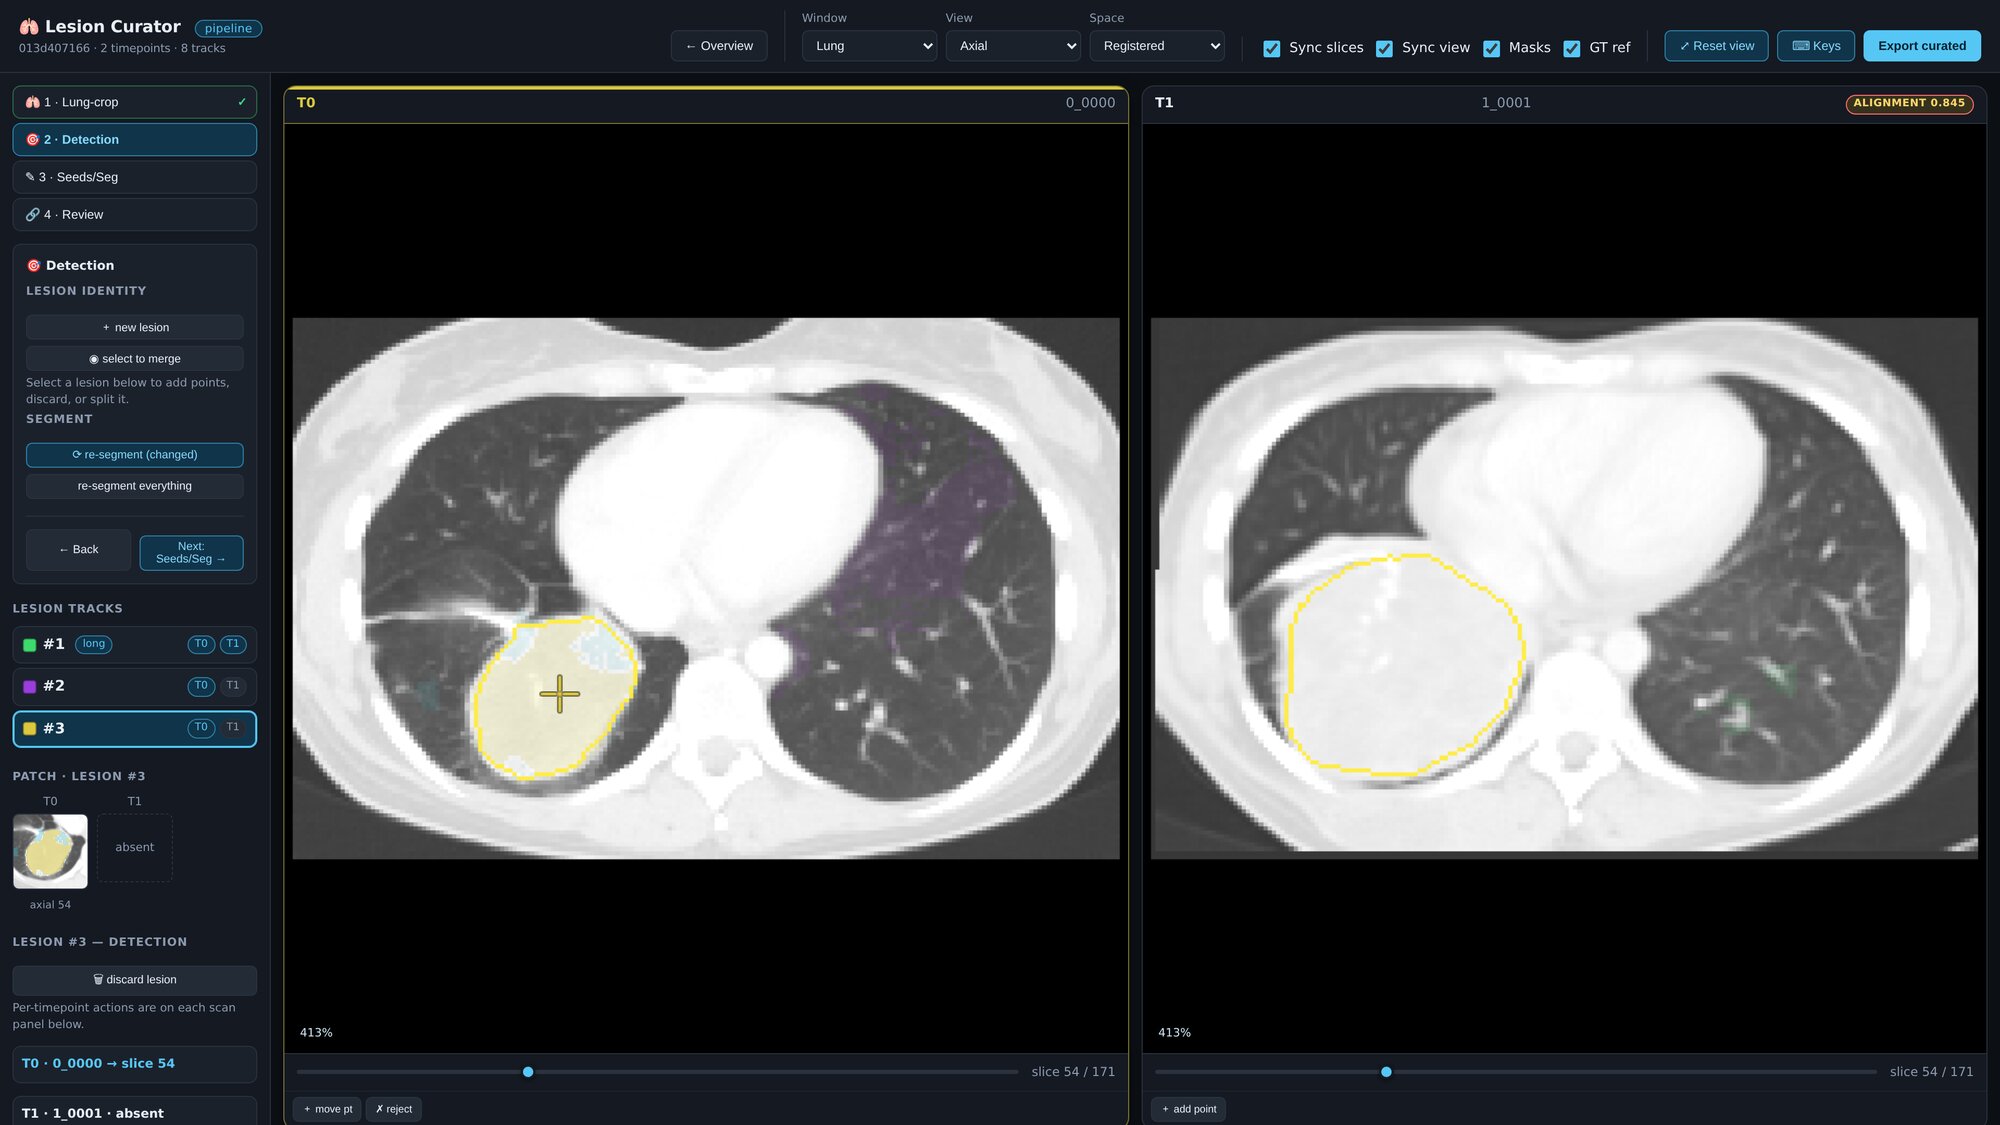 Two visits of one patient. The pipeline detected and masked the lesion on the first visit; on the second, the yellow reference outline marks a lesion it did not detect, the kind of miss a reviewer fixes. CT from the autoPET Longitudinal-CT dataset (FDAT Tübingen, doi:10.57754/FDAT.75kj1-64747), CC BY 4.0.
The interface changed as people used it. I was the first reviewer, then a radiologist doing a research postdoc. Actions moved from a sidebar to under each scan, so an action sits next to its image. Reviewers wanted to see volume change. A few interactions were too complicated and were simplified away. It is still a research tool in development, and a reader study is needed before I can say whether it saves time or improves the labels.
Making the slides
I made the talk the same way. I had the AI turn Stanford’s visual identity guide into a plain-text design rulebook, added rules for slides such as a minimum type size and how to caption a source, and in Claude Design turned that into a design system and a few templates. Then I spent my time on what each slide said. The styles stayed consistent because the rules did, and a change is a click on an element and a sentence.
The tool could not decide the point of a slide. The VAE lesion-size figure first came out beside a long explanation, with image grids too small to compare. I wanted the audience to see original, shrunk and enlarged lesions side by side, so we moved the explanation into the notes and enlarged the grids. Once I could say what people should compare, the tool could do the rest.
A good model is not yet a useful one
AI in medicine is not quite the AI everybody is talking about. In the FDA’s list of AI-enabled devices, downloaded September 7, 1,230 of 1,614 authorization records, about 76 percent, were under radiology. Those are records, not products or hospitals, and the FDA says the list is not comprehensive. Most are image processing and analysis: enhancing images, measuring and segmenting structures. SubtleMR produces enhanced MRI images, NeuroQuant reports brain volumes for a physician to review, and MammoScreen marks suspicious findings for the reader. A person still reads and decides.
Meanwhile attention has moved to language. In two specified PubMed searches, language-model papers overtook imaging deep-learning papers in 2024. My own view is that language will not absorb everything. I cannot describe a CT scan in words well enough for someone to picture it exactly, so I think the better path is a shared representation that keeps what is unique to each modality.
Even a model that works has to arrive in time. Susan Shelmerdine, a pediatric radiologist at Great Ormond Street Hospital, presented an emergency-department audit of an AI tool for children’s fracture X-rays at a Stanford IBIIS-AIMI seminar. Staff accuracy was about 84 percent before and after the tool was installed; the AI alone scored about 88 percent. It was a small before-and-after audit, so that does not show the AI was better, but staff performance barely moved, and the timing explains much of it.
Mean times from the pediatric fracture audit Susan Shelmerdine presented at the IBIIS-AIMI seminar. Averages, not times for every patient; the audit was not randomized.
Speeding up one step does not speed up the pathway either. The LungIMPACT trial, across five NHS trusts and more than 93,000 chest X-rays, had AI read the images in both groups and, on randomly assigned days, move X-rays it flagged up the reporting queue. Reports came back faster. CT scans and diagnoses did not.
Median times in LungIMPACT. The difference in time to diagnosis was not statistically significant. Woznitza et al., Nature Medicine 2026, Table 2.
A staff study from one NHS trust shows what moving the later steps takes. Offering a same-day CT after a concerning X-ray needed someone free to read the image, someone to coordinate, and CT slots matched to when patients arrived. Two fixed early-morning slots did not help patients who came later; even lunch cover mattered. And someone has to explain the finding to a patient who came in for an X-ray.
There are clear successes when a study measures the work that changes. In the Swedish MASAI trial, AI triaged mammograms so most went to one radiologist instead of two, and screen-reading workload fell by 44.3 percent with no reduction in cancer detection. With ambient AI scribes, reported burnout among 263 clinicians fell from about 52 to 39 percent after 30 days, though that was a before-and-after study and the time saved did not always mean more patients seen.
I closed on three gaps, the same three questions my research starts from. Data: look at the patient the way clinicians do, combining imaging, labs, history and pathology. Training: labels are expensive and data is hard to share across institutions, so learn from unlabeled data. Evaluation: test on private cohorts and populations the model never saw, with metrics that reflect how it would be used.
What I would try first
AI played several roles across these examples: it learned from images, combined patient data, organized my experiments, built a review tool and made the talk. In each one I chose the question, checked the analysis and worked out what a reviewer or an audience needed. The hospital studies show the same thing at a larger scale: a useful output needs a workflow and people who can act on it.
So the suggestion is small. Pick a part of your own work you understand well. Write down how it should be done, use AI to help with it, inspect what comes back, and improve the procedure as you learn. Learn more, build more.
The recording of the talk is here: https://www.youtube.com/watch?v=Kz_LV64xKjE.
If you have written down one step of your own research for an AI to follow, I would like to compare it with mine, especially the place where it went wrong. My links are on my profile.