CASE · 2026CASE · 2026
Eight chest X-ray models, nine datasets, and what one score leaves out
We ran eight published chest X-ray AI models on six public and three private datasets, and found that which model looks best depends on the findings you count, the metric you use and the patients you test on.
A chest X-ray is one of the most widely used diagnostic imaging tests in the world. There are now many published models that look at one and say whether it shows pneumonia, fluid around the lung, a collapsed lung, a fracture, or dozens of other findings. Previous evaluations have largely used US-based or single-institution datasets. A score on a held-out test set, meaning images the model never saw during training, says the model learned something. It says much less about what happens when the model meets a different hospital, a different kind of patient, or a question it was not built for.
This project is about that gap. With Qinmei Xu (we contributed equally), Olivier Gevaert and colleagues at Stanford and at hospitals in Nanjing, I took eight publicly available chest X-ray models and ran all of them on six public datasets and three private datasets from China. The question behind it is about evaluation: how much a model’s performance changes when the hospital, the patients or the task changes, and whether the numbers we report match how the model would actually be used.
The models and the data
The eight models fall into two families. Three are traditional image-only models trained on labelled X-rays: DenseNet, ResNet and X-Raydar. Each was trained on a fixed list of findings, so each can only answer the questions on its list. The other five are vision-language models: CheXzero, BioViL-T, MAVL, MedKLIP and PsPG. These learned from X-rays paired with the radiologist’s written report, so they link what an image looks like to the words that describe it. Some vision-language models can classify from new text descriptions, but the implementations we evaluated differ in which findings they support. MAVL’s released dictionary, for example, contains 24 predefined labels.
For data we used six public datasets (CheXpert, NIH (Google), OpenI, VinDr-CXR, PadChest and MIDRC) and three private datasets from four hospitals in China. The public sets gave 37 classification tasks, including pneumonia and pleural effusion. The private sets covered four findings: pneumothorax (a collapsed lung), pneumonia, pleural effusion (fluid around the lung) and fracture. One of them, 371 X-rays of children, turned out to matter more than its size suggests.
Why a fair comparison is hard
Every model expects its images prepared its own way, so we converted all images to one common format and then applied each model’s own steps. The bigger problem is that the models do not answer the same questions. Of the 37 public findings, DenseNet and ResNet could score 17, X-Raydar 16, MAVL and MedKLIP 24, and BioViL-T, CheXzero and PsPG all 37. Averages over different sets of findings are not a controlled comparison. So we report two views: each model on everything it could attempt, and all eight models on the 11 findings every one of them could score.
There is also a possible overlap. Several of the public datasets we tested on, including CheXpert and PadChest, are also listed as training sources for some of the models, and the preprint does not quantify how much of the test data the models had seen. For those models, part of the public result may be a test on familiar material. That is one reason the private hospital data matters.
The ranking depends on what you count
On the 11 shared findings, MAVL ranked first on 7, using AUROC and AUPRC added together (AUPRC is explained below), and its mean AUROC was the highest, 0.88, against MedKLIP’s 0.87. AUROC (area under the receiver operating characteristic curve) measures how well a model distinguishes images with a target finding from images without it. It is the chance that the model gives a randomly chosen positive case a higher score than a randomly chosen negative one: 0.5 is a coin flip and 1.0 is a perfect ranking.
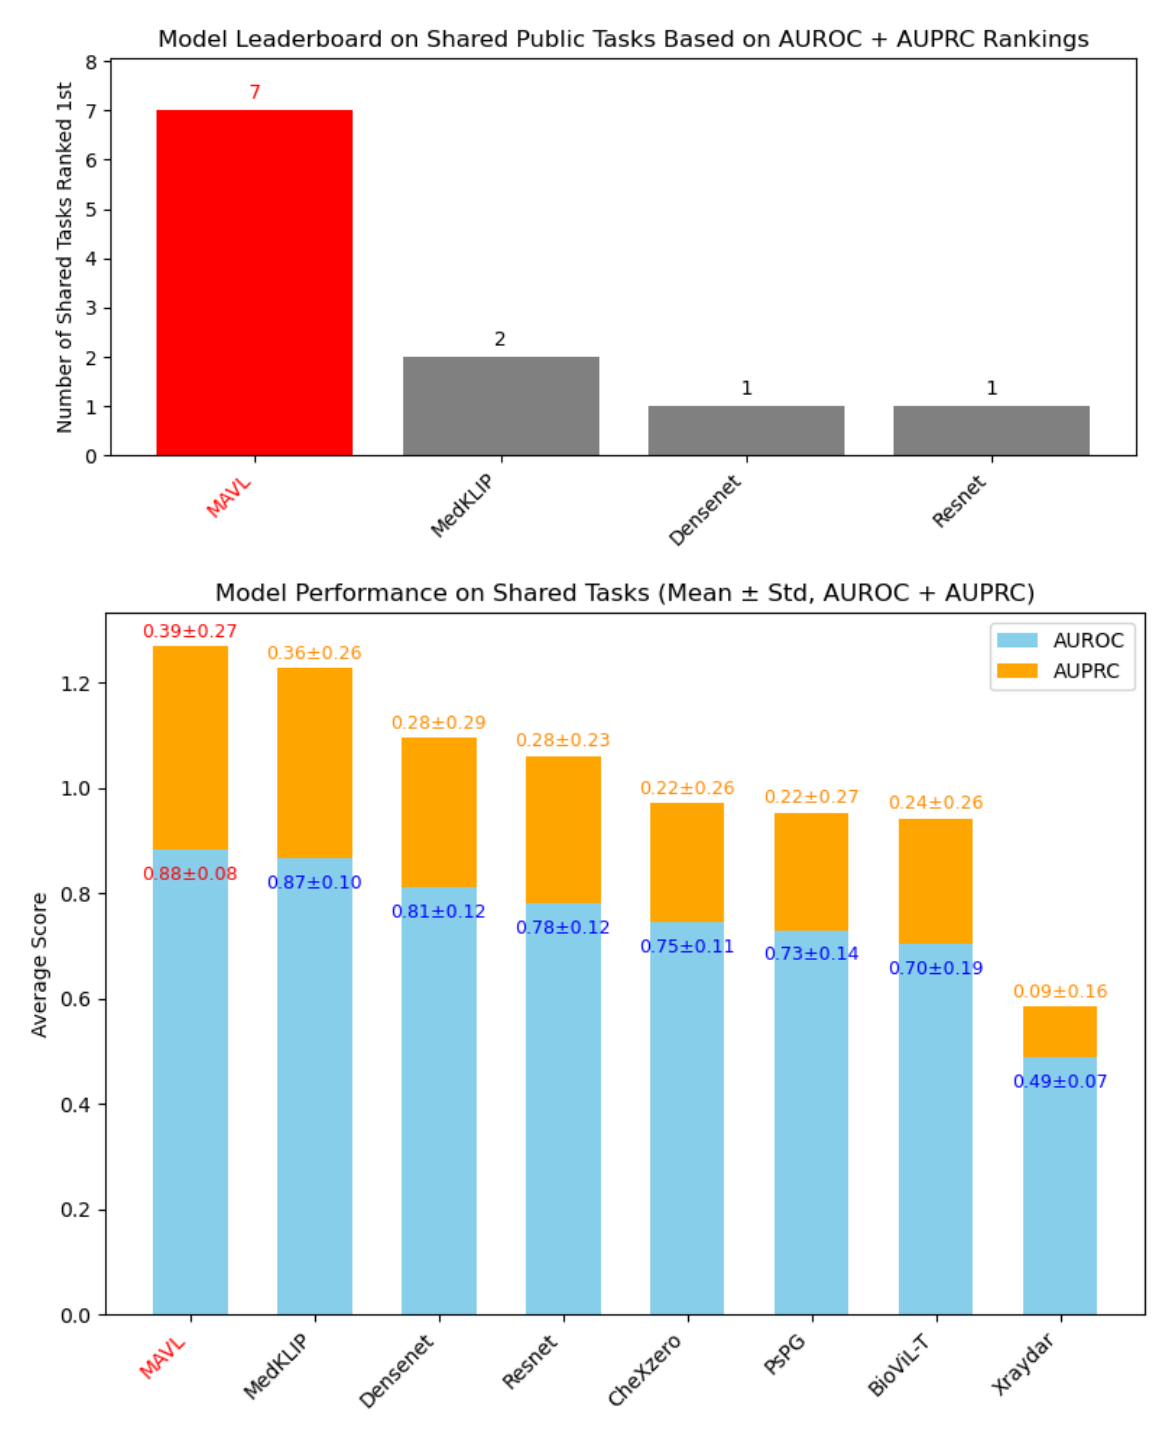 The 11 findings all eight models could score: how often each model ranked first by combined AUROC and AUPRC (top) and its average AUROC (blue) and AUPRC (orange) (bottom). Figure 3, Xu, Li et al., arXiv:2505.16027 (2025), CC BY 4.0.
We think MAVL’s structured descriptions may contribute to its lead. It breaks each disease description into parts, such as how dense the shadow is, its shape, where it sits and its texture, and learns to match each part to the image. The benchmark compares results between models, so it does not prove which design component caused the differences.
Change the counting and the picture shifts. Across every finding each model could attempt, BioViL-T, CheXzero and PsPG covered all 37 but averaged AUROC of only about 0.65, while MAVL covered 24 and averaged 0.82, the same as DenseNet on its 17. The preprint attributes the weaker average partly to rare or ambiguously labelled findings, where some scores sat close to 0.5, although others were much higher. A model that can be asked a question is not the same as a model that answers it well, and a leaderboard that shows only averages hides that trade.
A good ranking score can hide many false alarms
The number that changed how I think about this project sits next to AUROC in Figure 2. On the public data MAVL’s average AUROC was 0.82, but its average AUPRC was 0.32. AUPRC (area under the precision-recall curve) asks a different question. Precision is the fraction of flagged images that are true cases, and recall is the fraction of true cases the model catches; AUPRC summarizes how the two trade off as the threshold changes. An AUPRC of 0.32 is not the precision at any particular threshold. We report it alongside AUROC to assess how well a model finds positive cases when they are rare, and the paper identifies weak performance on several rare or ambiguously labelled findings.
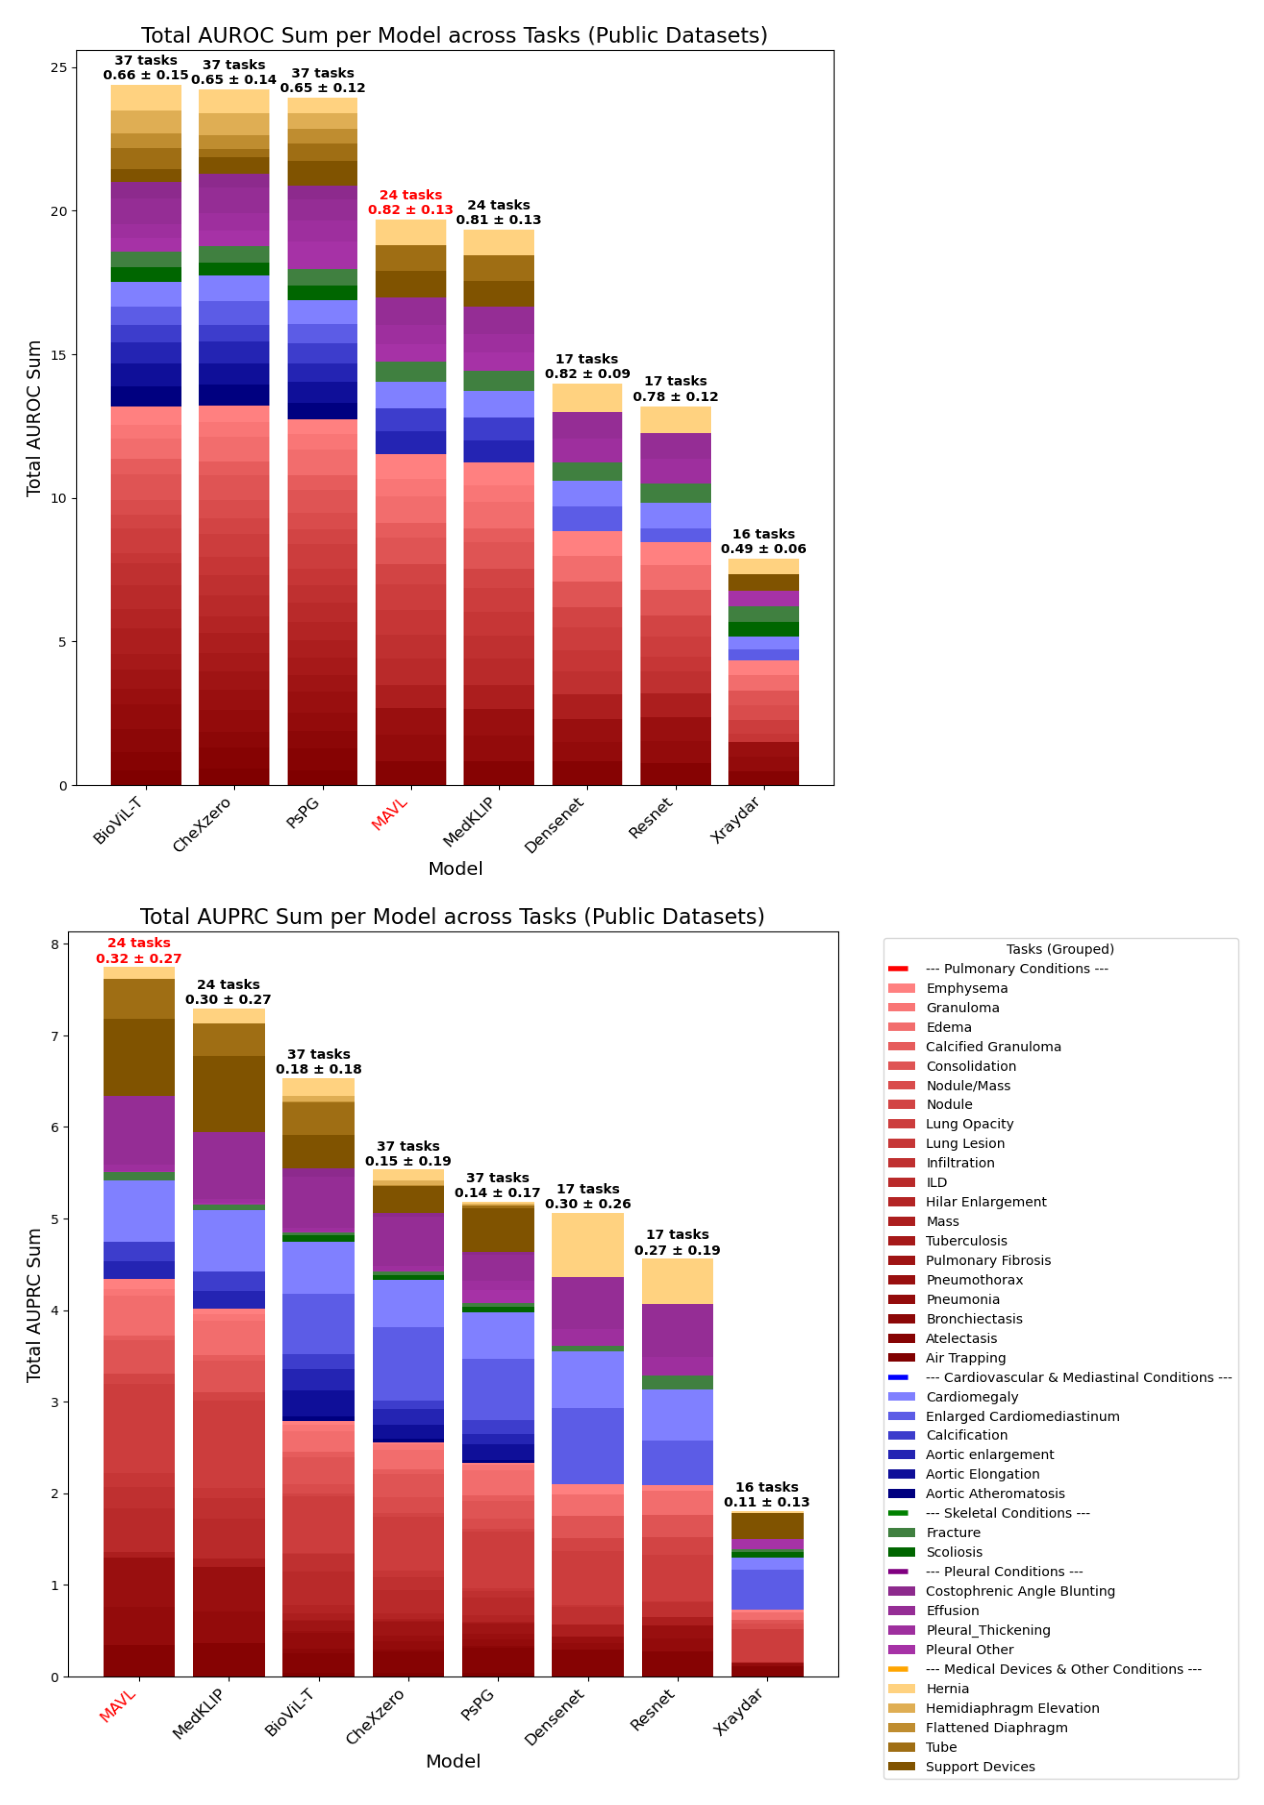 Every finding each model could attempt on the public data: summed AUROC (top) and AUPRC (bottom), with the number of findings and the mean above each bar. Figure 2, Xu, Li et al., arXiv:2505.16027 (2025), CC BY 4.0.
This is what I mean when I say the metrics we use most may not match the clinical use. In a hospital a model is not a ranking. It is a rule: when the score is above some level, someone acts. A radiologist reads that image first, a patient is called back, a report is flagged. Choosing that level is a trade between safety and efficiency. A smoke alarm is a fair comparison: you set it to prioritize catching fires, and then the real question is how often it goes off for toast. For a use like that you would fix a very high sensitivity, meaning the model catches nearly every true case, and then measure how many images without the finding it still flags and how often a flag is right. That point on the curve is the operating point, and a single AUROC does not tell you what happens there. The main results emphasize AUROC and AUPRC, so they do not answer that question directly. It is the first question I would ask of a model before using it.
Change the patients and performance changes
The clearest example came from children. Every model we tested was trained on adult X-rays. For pneumonia in adults from the Nanjing hospitals, the eight models averaged an AUROC of 0.81. On 371 pediatric X-rays from the same region, they averaged 0.57, not far from a coin flip. MAVL went from 0.95 to 0.81, CheXzero from 0.79 to 0.53. With only eight models, we used a bootstrap, which repeatedly resamples the observed results to estimate uncertainty. With 10,000 iterations, the 95% confidence interval for the drop in mean AUROC was 0.034 to 0.462, with p = 0.0202.
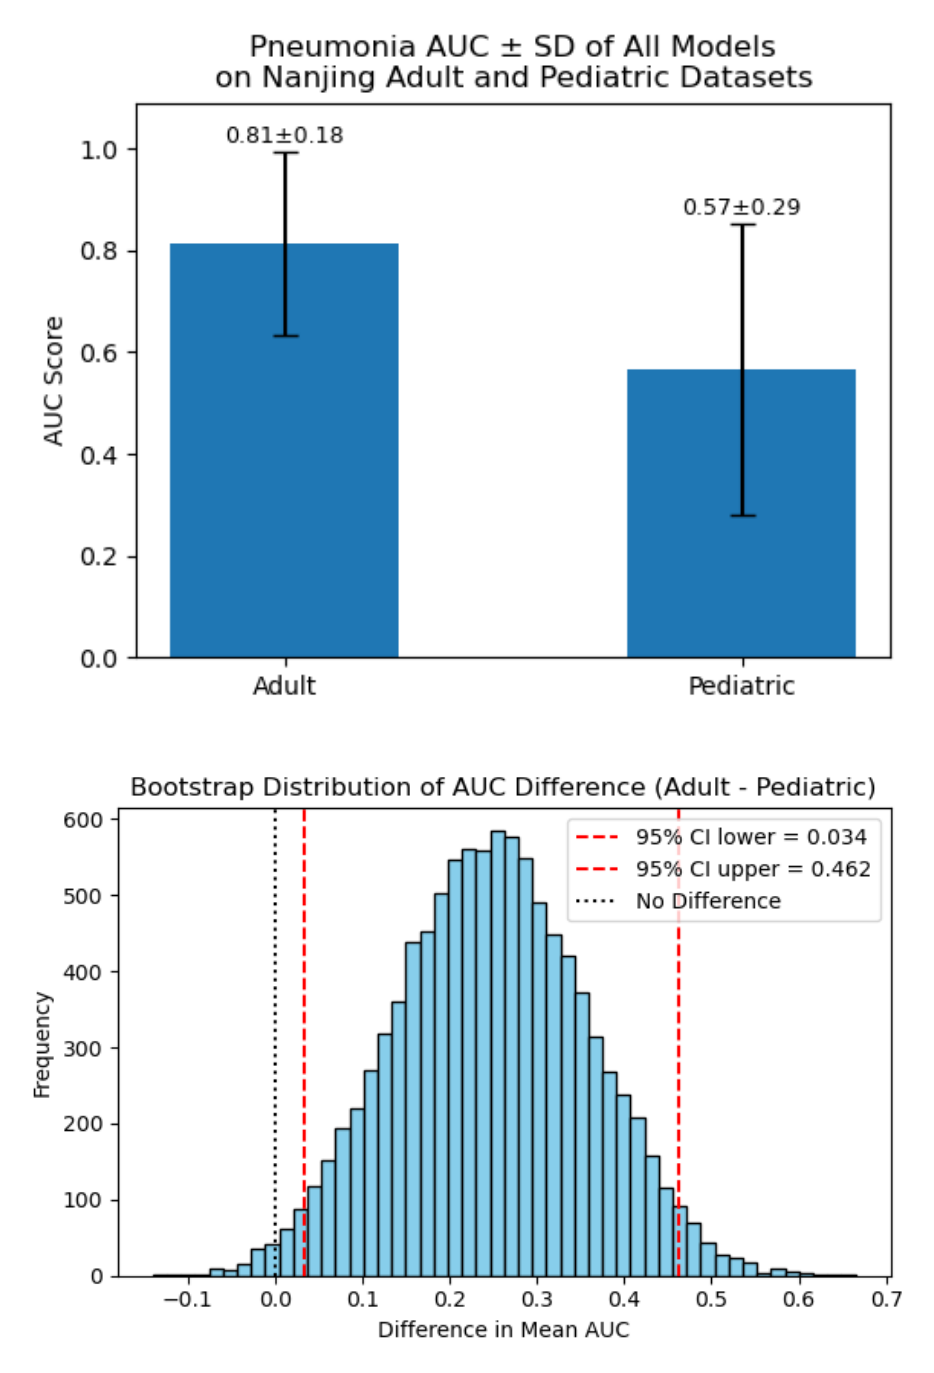 Pneumonia AUROC across all eight models, adults versus children (top), and the bootstrap distribution of the difference (bottom). Figure 7, Xu, Li et al., arXiv:2505.16027 (2025), CC BY 4.0.
Children differ from adults in anatomy and in how their images look. Adult-only evaluation does not establish how a model performs on children. In this benchmark, performance declined to different degrees across models.
A second example: X-Raydar’s training dataset contained 2,513,546 studies from the UK’s National Health Service, and it ranked last on both the public data (mean AUROC 0.49 across 16 tasks) and the private data (0.36 across three tasks, worse than a coin flip). We did not isolate why. It could be differences in patients, equipment or how findings are defined. Whatever the reason, a very large training set did not carry over to these settings.
One result needs care. MAVL’s mean AUROC was higher on the private hospital data than on the public data, 0.95 against 0.82, but this was not true for every model. That does not mean the models work better in hospitals. The averages cover different sets of findings and populations: MAVL’s public mean covers 24 findings and its private mean covers four, so the comparison cannot isolate the effect of changing hospitals.
What this did not show
This is a retrospective study: existing images, scored after the fact. The preprint reports diagnostic classification performance, not measured changes in radiologist reading time or patient outcomes. Those need their own studies.
The main results are AUROC and AUPRC. The supplement also reports threshold-dependent metrics, but the preprint does not document a common clinical operating-point analysis, so the headline numbers describe how well the models rank cases, not how a deployed model would behave at a chosen threshold.
The private data came from one region of China, and the pediatric result rests on one dataset and one finding, pneumonia. Several public test sets are also listed as training sources for some models, and the preprint does not quantify the overlap. And we compared eight model implementations using common image standardization followed by model-specific preprocessing. A model adjusted on local data might do much better, so this tells you about these implementations as we ran them, not about the best each design could do.
What I took from it
The lesson I keep is to evaluate a model at the operating point and in the setting where you hope to use it. A held-out score or a place on a leaderboard does not tell you whether it will reduce workload or help patients in your hospital. That needs its own evidence, and the evaluation has to continue after a model is put to use. The preprint describes plans to expand the benchmark to data from Germany, Turkey and Japan and to explore combining models.
Part of a series
I think about my research through three questions: what data we use, how we train, and how we evaluate. This post is the evaluation one. Predicting severe COVID-19 around admission from a CT scan, the chart, and a blood test is about data: whether a model, like a doctor, gains from combining the scan with other information about the patient. Teaching a model to redraw lung tumors, then reusing what it learned is about training: learning useful image features before there are expert labels for every outcome. Together they are what information we use, what we learn from it, and how we know it will help.
I presented the three projects together in my OpenRefinery talk, “AI for Biomedicine”, in September 2026. The recording is here: https://www.youtube.com/watch?v=Kz_LV64xKjE.
The preprint is open: Xu Q., Li Y., Zhan X., Er A.G., Dashevsky B., Xu C., Alawad M., Yang M., Ya L., Zhou C., Li X., Itakura H., Gevaert O. “Benchmarking Chest X-ray Diagnosis Models Across Multinational Datasets.” arXiv:2505.16027 (2025). https://arxiv.org/abs/2505.16027